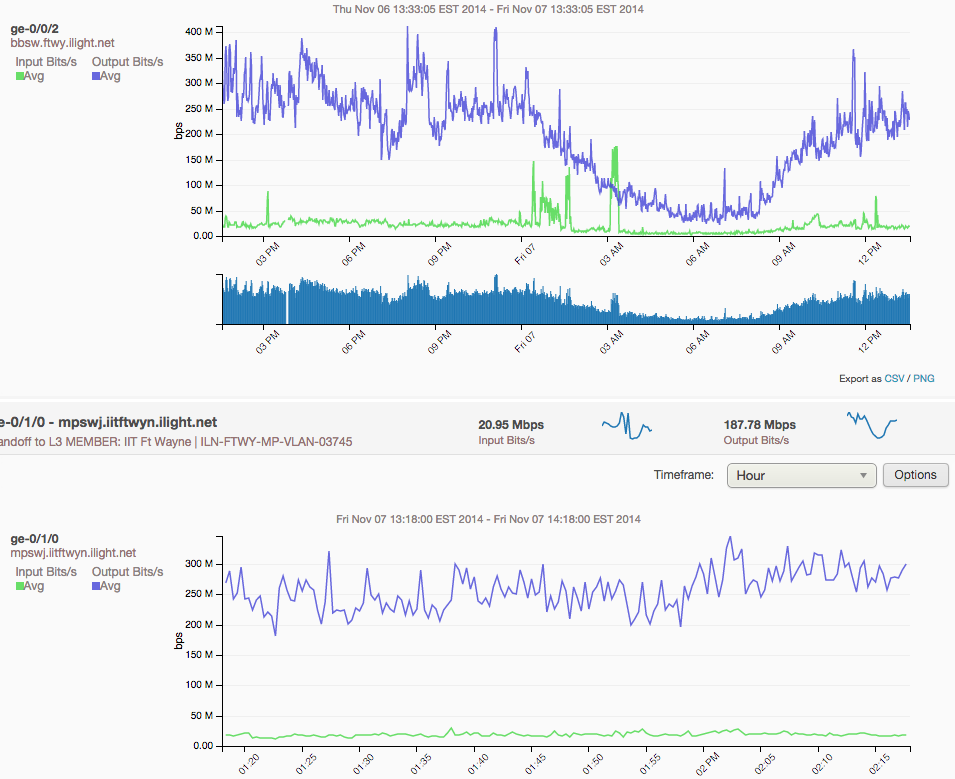
To combine two charts, drag one and drop it on the other. For example, these two charts:

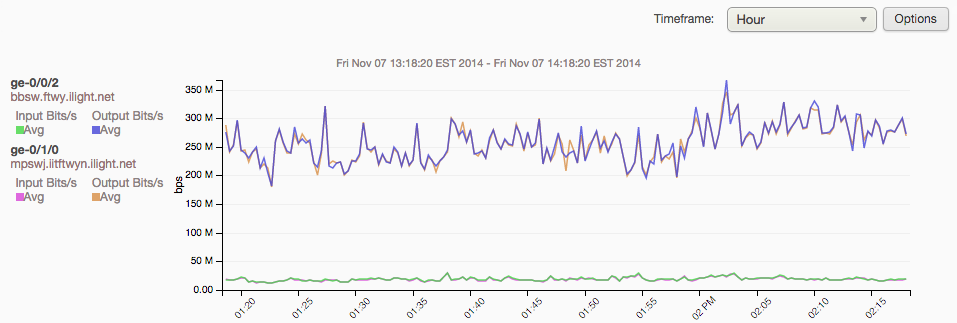
Can be combined. Simply drag the header area containing the date range from one chart onto the other. A combined chart will be displayed.

In this view, clicking Options and adjusting the Chart Types can be useful. Refer to the documentation for Chart Types for more information.