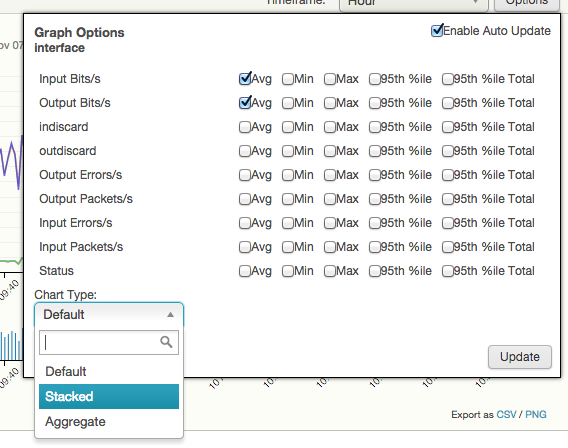
To change the chart type, click the Options button.

Then, use the dropdown to select the desired chart type. Click Update to confirm the selection.

Three chart types are available:
- Default
-
Shows each value as a separate line, with all values displayed on one chart.
In this example, Input and Output bits per second are being displayed for two interfaces. Each value has its own line.

- Stacked
-
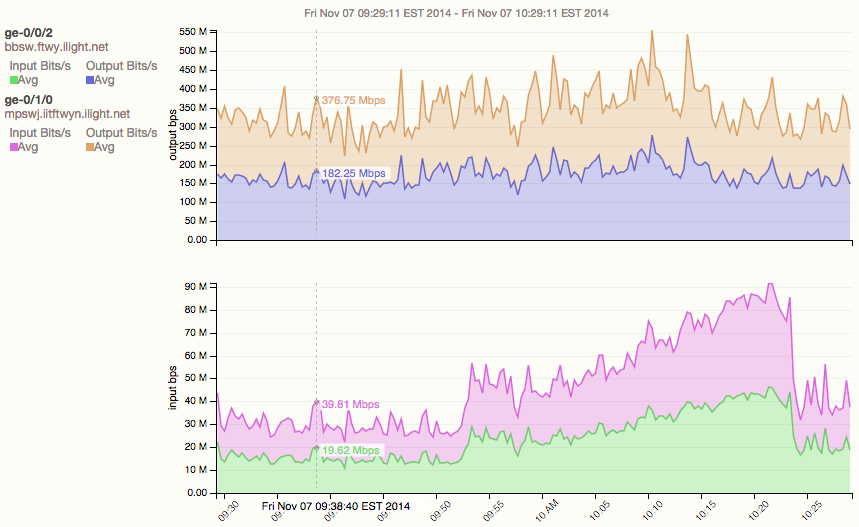
Groups like values together and splits the view into separate charts.
In this example, Input and Output bits per second are being displayed for two interfaces. Two separate charts are displayed -- one for Input bps, and another for Output bps. Each chart shows two lines, one for each interface being displayed.

- Aggregate
-
Combines values of the same type (only useful if combining multiple charts - see Browse documentation). In this example, one chart is displayed, with two lines. One line shows the total Input bps, the other shows the total Output bps.
