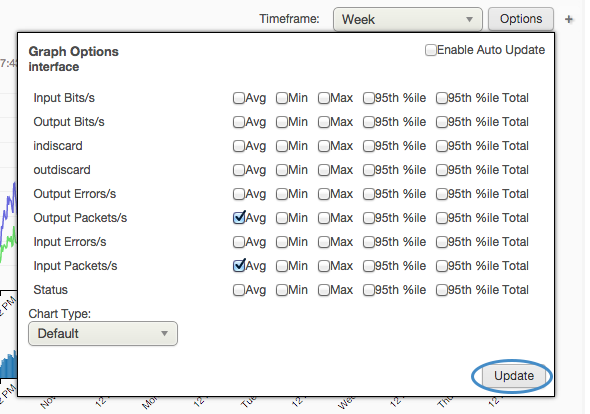
To select the values to display on the chart, click the Options button.

Select the fields to display.

In this case Output Packets/s and Input Packets/s have been selected, and only the Average values will be displayed. Other options include minimum, maximum, 95th percentile, and total 95th percentile.
Click Update to redraw the chart.